
Redskin Gridiron History – Fun Facts 2
Most Prolific Year Scoring Part I: Oh that 1960 team – they were quite a club. Tough on defense and number one on the charts when you consider that they played 11 games and scored 436 points which worked out to a heart stopping, pulse pounding (and still best ever as we just said) average of 39.63 points scored every game that year. In fact, for 45 years that record has stood tall with its closest call at being “topped” being the 2005 squad’s 448 point output over its 12 games which produced an average of 37.33 points a game (just about a field goal shy of the 60 guys and their record). Anyhow you slice it, that’s some serious scoring going on there we’d say.

Most Prolific Year scoring Part II: Okay, okay – so the 1960 team and the 2005 team “averaged” a bunch – who scored the most in a season is what you really want to know now, isn’t it? Well, how about the 2013 team which played 15 games, captured the D1 trophy and then played St. Joe’s Prep in the Eastern Championship while scoring 531 points in the process. Not bad, not bad at all! And in case you can’t find your calculator, we’ve got it handled: That’s an average of 35.40 points per game. Pretty sweet and certainly a large part of the reason the ’13 Redskins finished 13-2.

Most Prolific Scoring Year Part III: Alright then – we’ve expanded this bit a scoring history a bit and thought you might like to see a list of the top 10 highest scoring teams (that means most points scored over a season) in Redskins history. Here they are:
Most Points in a season:
- 2013 – (531 pts, 15 g, 35.40 aver.)
- 2004 – (466 pts, 15 g, 31.06 aver.)
- 2007 – (449 pts, 13 g, 34.54 aver.)
- 2005 – (448 pts, 12 g, 37.33 aver.)
- 1960 – (436 pts, 11 g, 39.63 aver.)
- 2010 – (423 pts, 14 g, 30.21 aver.)
- 2016 – (421 pts, 12 g, 35.08 aver.)
- 1961 – (417 pts, 12 g, 34.75 aver.)
- 1962 – (397 pts, 11 g, 36.09 aver.)
- 2001 – (387 pts, 15 g, 25.80 aver.)
Most Prolific Scoring Year Part IV: We say this over and over and over (and do it over and over and over); however, this is it – no more on this topic. So here goes: The top ten teams for Best Average Per Game over a whole season are as follows:
- 1960 – 39.63 points per game
- 2005 – 37.33 points per game
- 1962 – 36.09 points per game
- 2013 – 35.40 points per game
- 2016 – 35.08 points per game
- 1954 – 34.90 points per game
- 1961 – 34.75 points per game
- 2007 – 34.54 points per game
- 1959 – 34.18 points per game
- 1971 – 33.73 points per game
Wow! Those ten teams can play for us anytime (talk about being able to put points on the board). In fact, we were going add all that up but the battery in our calculator died while we were punching in the numbers. So maybe we should just leave well enough alone and say that it looks like that bunch averaged five touchdowns a game during those ten seasons. Now that’s scary – and quite enough about scoring for now.
Too Much Time Scoring Statistics – Part I: Bob Willits made us do this one.
As if one year at a time wasn’t enough to get you edgy, Bob decided to check for the best average per game (that’s points the ‘Skins scored per game) over two year back-to-back seasons. So we came up with the top 5 two-year per game averages. Here they are folks:
- 1960 and 1961 (23 games) = 37.09 average per game
- 1959 and 1960 (22 games) = 36.91 average per game
- 1961 and 1962 (23 games) = 35.39 average per game
- 2004 and 2005 (27 games) = 33.85 average per game
- 2016 and 2017 (24 games) = 32.88 average per game
- 1971 and 1972 (22 games) = 31.91 average per game
Why you’re reflecting on the above (and the very, very evident fact that we are spending way too much time on this site) you might notice that 1959, 1960, 1961 and 1962 saw some serious scoring going on at the old Neshaminy reservation. In fact, if you add up those four season totals (it’s 1,626 points all together) and divide the total by the number of games they played (45) it looks like this: 1,626 divided by 45 equals 36.13. Oh, I get it – you guys are saying that over a four year period (1959 through 1962) the ‘Skins averaged 36.19 points a game. Kind of helps you understand that 41-2-2 record.
And chew on this for a while, the only two losses the ‘Skins suffered during that run were to Easton (which was running the tables left and right in those days as the “other” best team in the state) with both of those scores being 13-7 for the Dogs (in 1959 and 1961). In 1960 the annual tussle with the Rovers ended in a 13-13 tie while in 1962 the ‘Skins took them down, 13-7.

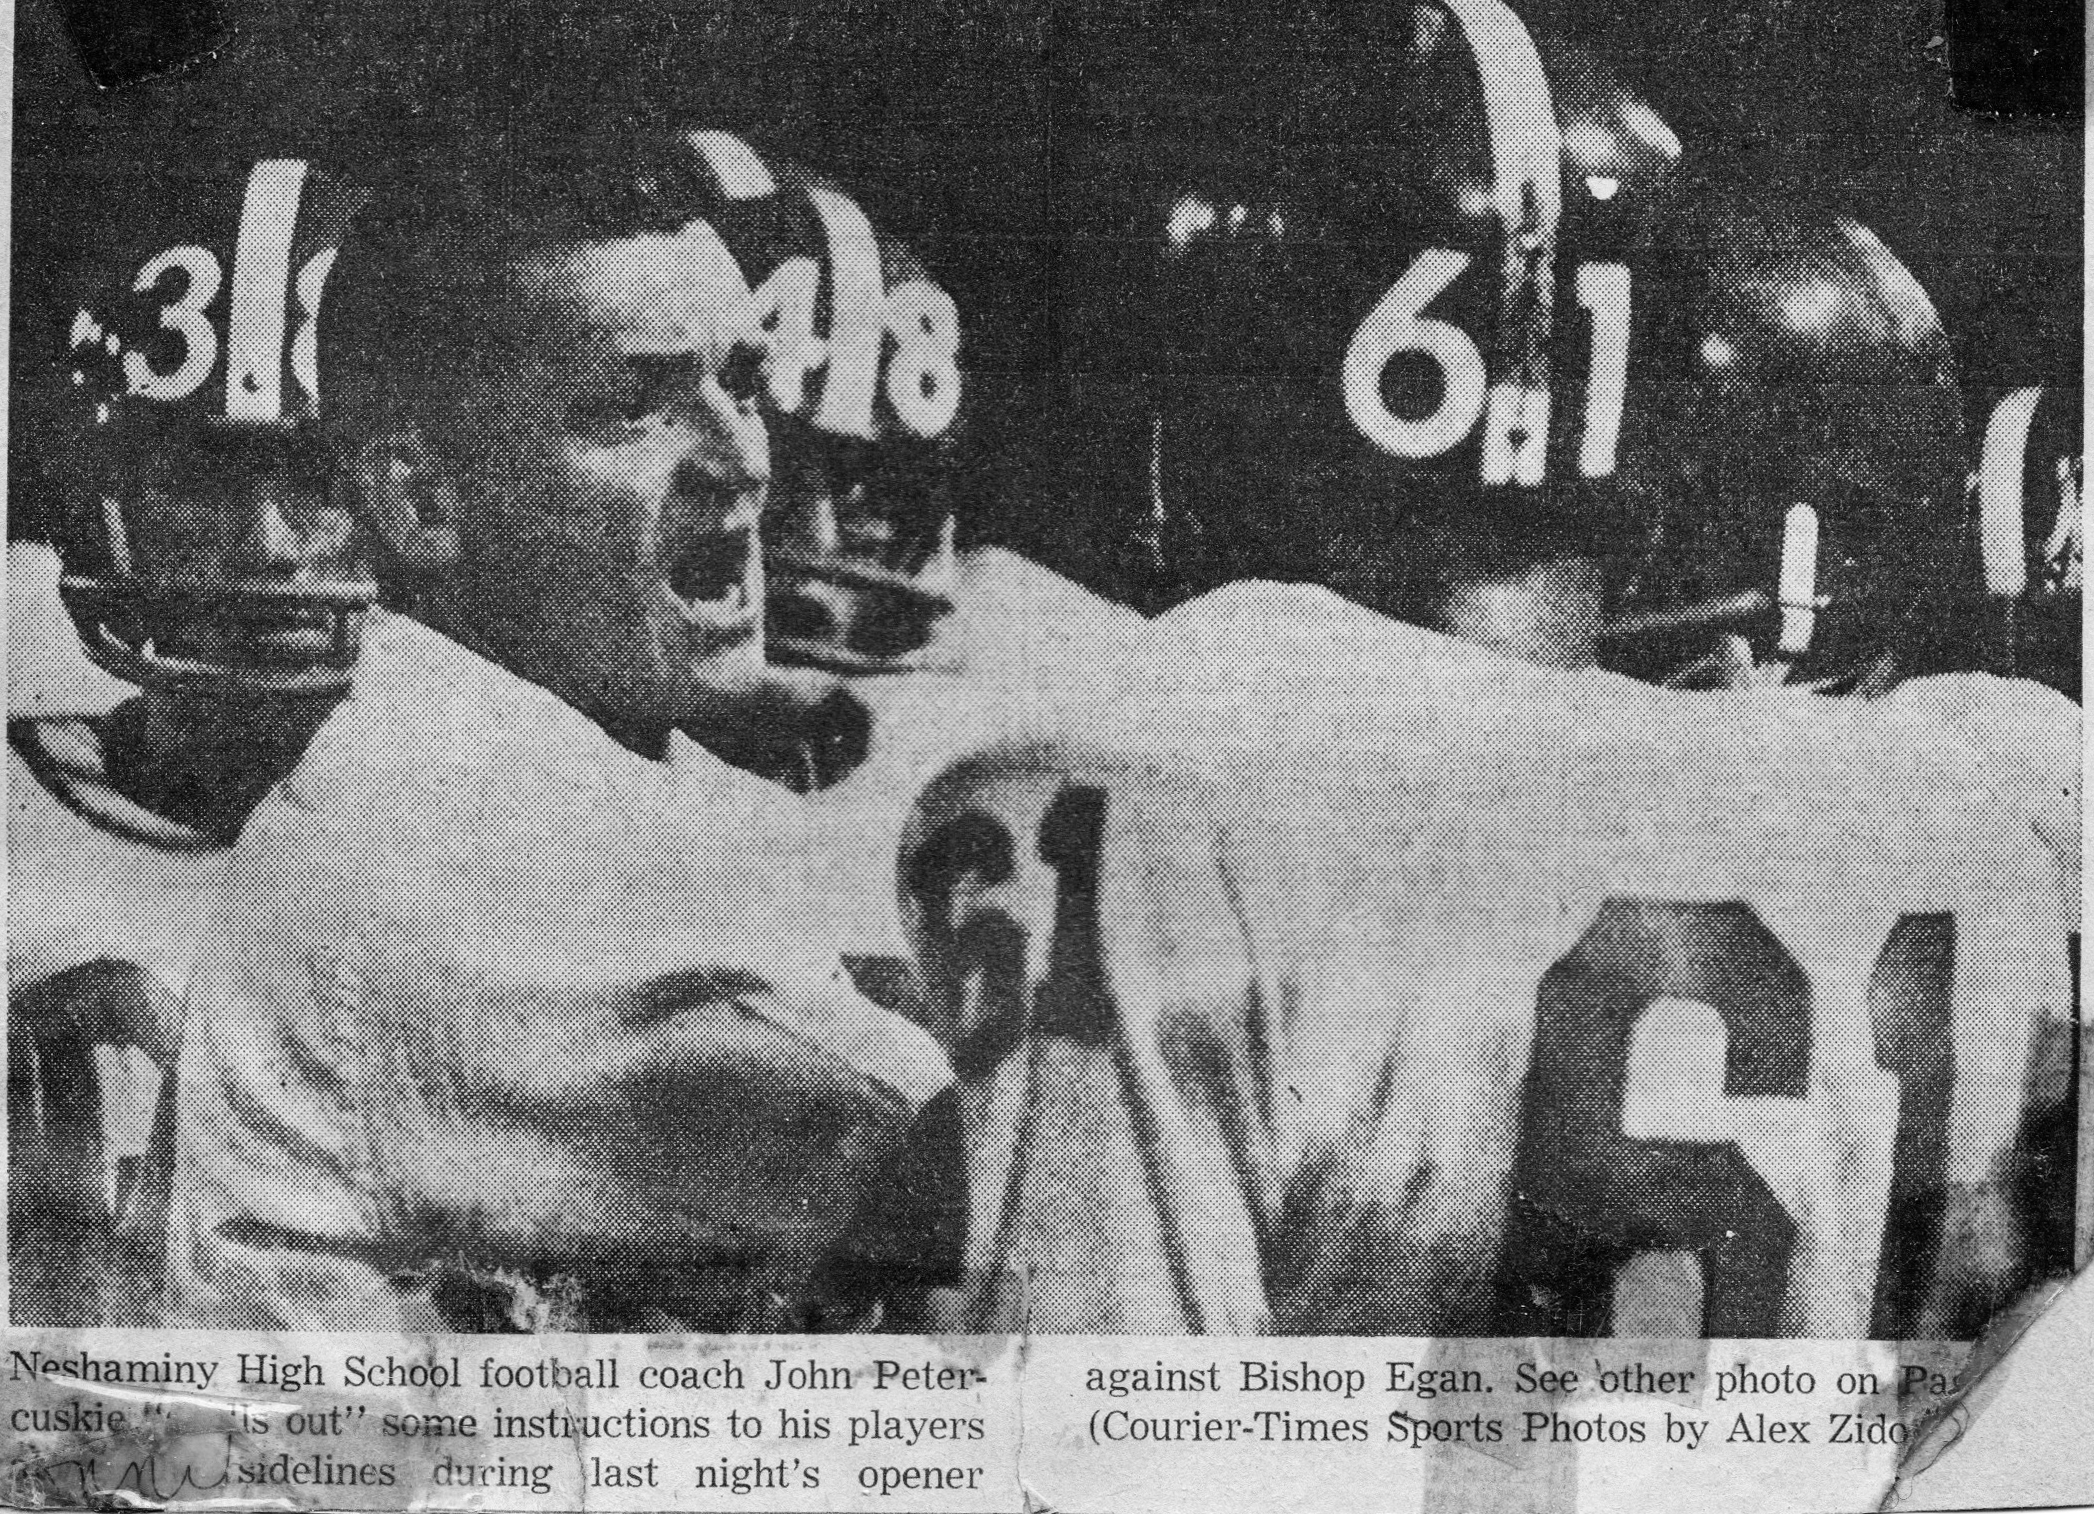
October 9, 1959 Game against Easton
One last thing: Those two losses to Easton were the only two losses the Redskins of Neshaminy had to endure from 1959 through 1965. That’s 76 games in all over 7 years marred by just 2 “L” column entries resulting in an overall record of 69-2-5 (we may have touched on this before and if so – we’re sorry).
Too Much Time Scoring Statistics – Part II: This just had to be done (believe me – we had no choice). Remember the back-to-back best scoring average over a two year period thing? We thought we’d tweak it a little and line those years up by most points scored – so here they are (no yawning as this is very important to us):
- 2004 and 2005 – 914 points
- 2012 and 2013 – 878 points
- 1960 and 1961 – 853 points
- 1961 and 1962 – 814 points
- 1959 and 1960 – 812 points
- 2016 and 2017 – 789 points
- 1971 and 1972 – 702 points
Certain people have suggested that we take our calculator and put it away for a while. A comment was also overheard suggesting that some fresh air and another hobby (building model airplanes, for instance) might be a good idea.
Most Shutout’s in a Season:
- Just two clubs can lay claim to that prize (the 1961 and 1938 squads).
- As an interesting aside (and good for cocktail party banter), although the 1938 team had 6 shutouts one of those was not a win (instead going in the books as a 0-0 tie).
- Five seasons saw the ultimate in defense 5 times: 1965, 1960, 1959, 1958 and 1930.Six teams share that honor with those being the 2004, 1987, 1970, 1964, 1956 and 1946 editions.